


Introduction by Legion Oil & Gas LLC: Welcome to the inaugural issue of the “European Petroleum Coke” newsletter. While the European market for petroleum coke may not be as large as those in the USA or China, it is highly dynamic, especially due to regulatory developments. Our goal with this series is to provide a nuanced perspective on the European petroleum coke market, utilizing visualizations and interpretations of publicly available data to better understand market processes.
Objective: This newsletter series aims to offer insights without necessarily forecasting market trends. Instead, we focus on a retrospective analysis based on events that have occurred within the reporting period, supported by official statistics.
Methodology and Data Sources: Each issue will clearly outline the methodologies and sources of data used to ensure transparency and reliability in the information we provide.
Current Issue Focus – Review from 2018 to 2023: Our first issue takes an extensive look back from 2018 through 2023, setting a baseline for understanding market evolution. Future issues will cover more specific time frames, enabling a detailed exploration of recent changes and trends.
Visual Insights: To aid in the comprehension of complex market dynamics, we will employ various visualization techniques. Graphs, charts, and maps will illustrate production trends, import-export flows, and regulatory impacts over the covered period.
EU Petcoke production output
Eurostat’s compiled data on petroleum products distinctively includes petroleum coke under the code O4694. Since calcined petroleum coke is derived from processing green petroleum coke, we infer that Eurostat’s production statistics predominantly represent green petroleum coke volumes.
Over the past six years, several Delayed Coker Units (DCUs) have been commissioned across European refineries, notably in countries like Poland and the Netherlands. This expansion is evident from the increased production capacities in these regions, highlighting significant investments in refining technologies.
Additionally, a new DCU was launched in Serbia at the Pancevo refinery (NIS). Although Serbia is not currently part of the EU, this development is critical for understanding broader European petcoke production trends outside the EU statistics.
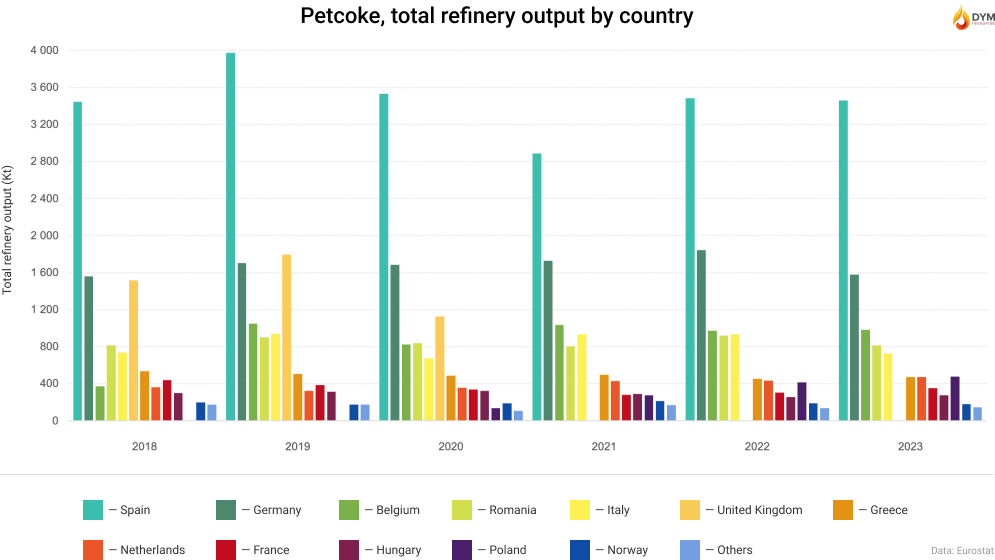
Following BREXIT, data on petcoke production in UK refineries ceased to be included in Eurostat’s collective EU statistics, with available UK data only up to the year 2020. This change has necessitated adjustments in tracking and comparing petcoke production figures across the continent.
To gain access to the next quarterly newsletters, please fill out the form.
Petroleum Coke Import/Export statistics
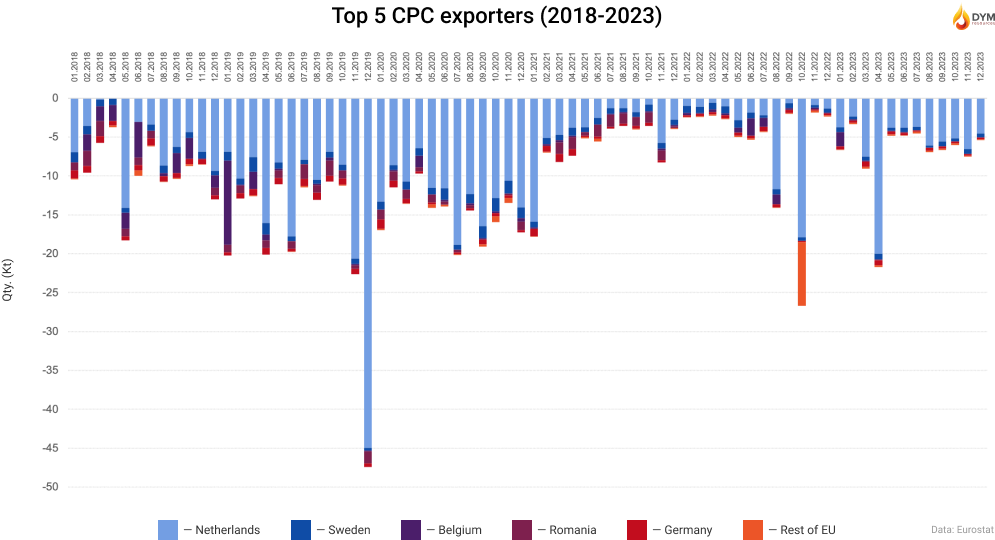
The cement industry remains the global leader in the consumption of green petroleum coke, which constitutes a significant portion of the world’s total petcoke production. In Europe, countries with substantial clinker production capabilities—namely Spain, Germany, Italy, France, and Poland—are the largest importers of total petroleum coke. Collectively, these nations account for over 70% of the total annual EU clinker production and are also prominent importers of green petcoke.
For customs purposes within the EU, green petroleum coke is classified under HS code 27131100, and calcined petroleum coke under 27131200. Unlike in some regions such as China, these codes do not allow for differentiation by sulfur content, leading to average pricing data that does not specify product quality. The production in different countries tends to focus variably on anode or fuel-grade coke, depending on the quality of feedstock available.
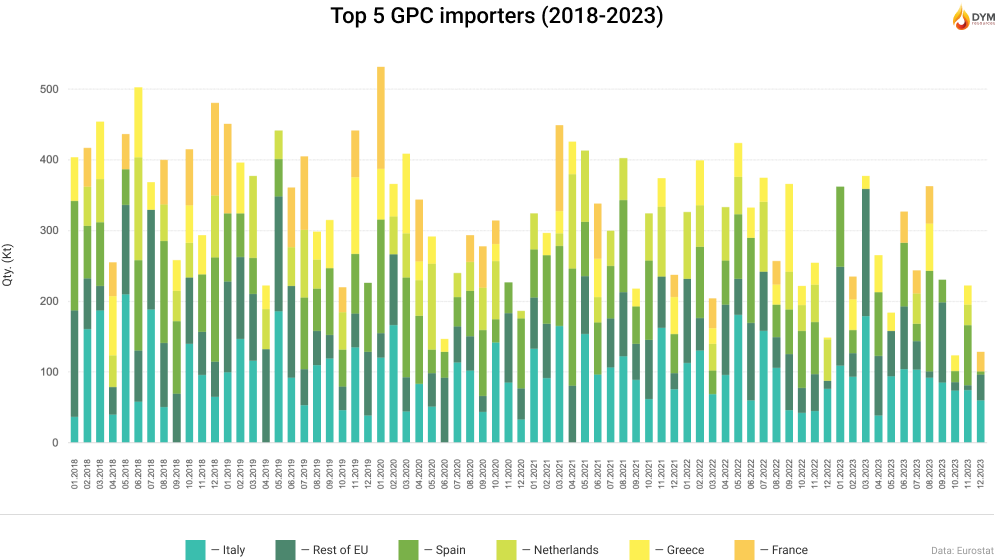
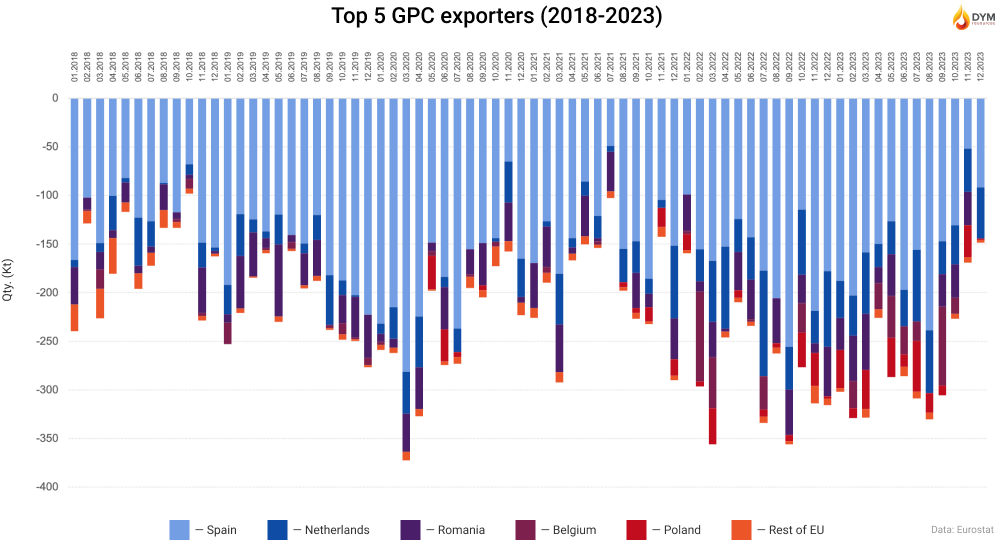
Spain, which possesses the largest capacity for Delayed Coker Units and is among the top importers of green petroleum coke, also emerges as a significant exporter of the same. This dual role highlights its strategic position in the European petcoke market.
The primary aluminum production sector in the European Union has been on a downward trend over the past five years. High energy costs and strict environmental regulations have challenged the competitiveness of European producers, leading to decreased investments, closures, and a significant reduction in production capacity. By the end of 2022, European Aluminium reported that the EU had lost about 50% of its primary aluminum production capacity, equivalent to approximately 1.2 million tones (European Aluminium). This reduction has had a profound impact on the market for calcinable and calcined petcoke in the EU.
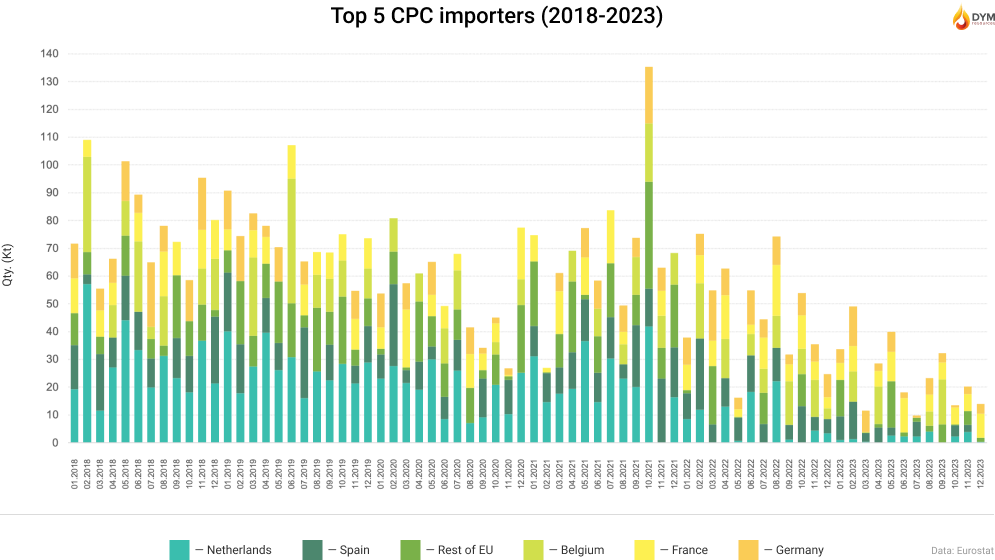
Since 2022, the import of calcined petcoke has consistently declined. Export trends, however, have varied due to technical reasons related to the calcination facilities at European refineries.
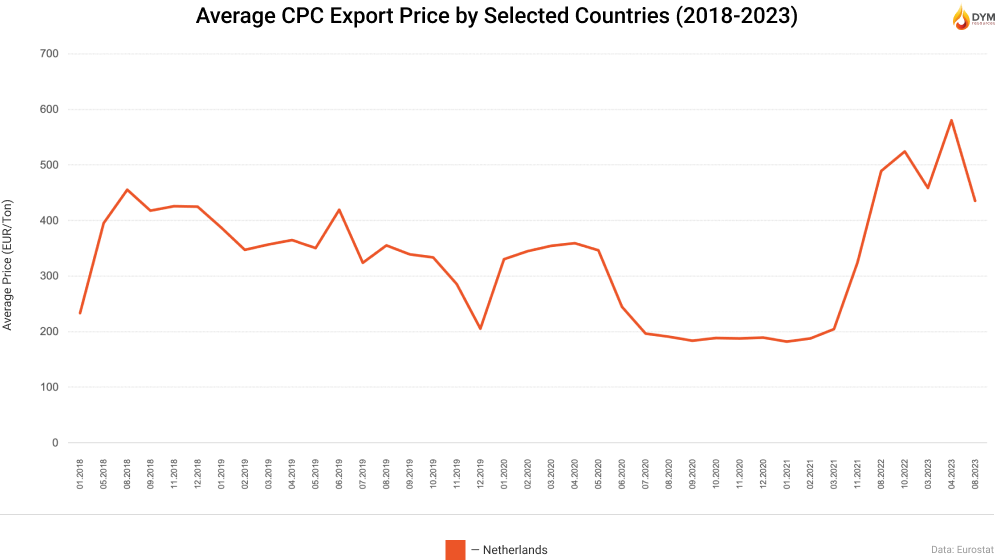
Petroleum Coke Average Price Trends
This section provides a visualization of the average price trends for Green Petroleum Coke (GPC) and Calcined Petroleum Coke (CPC) as traded by major players within and outside the EU. Data from Eurostat is utilized to track price changes, focusing on top countries by monthly traded quantity. To offer a clearer perspective and manage data variability, only records involving more than 4,000 tons are included in our analysis.
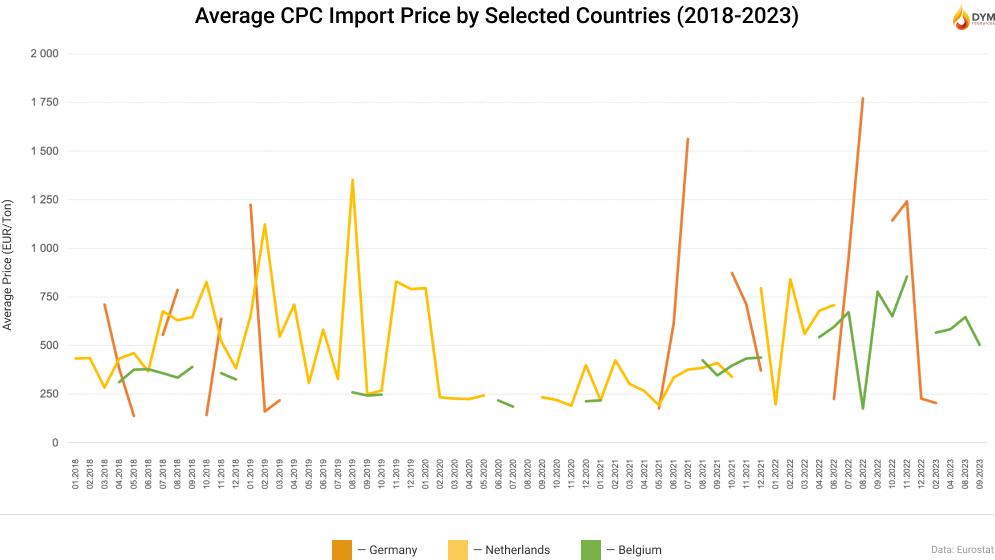
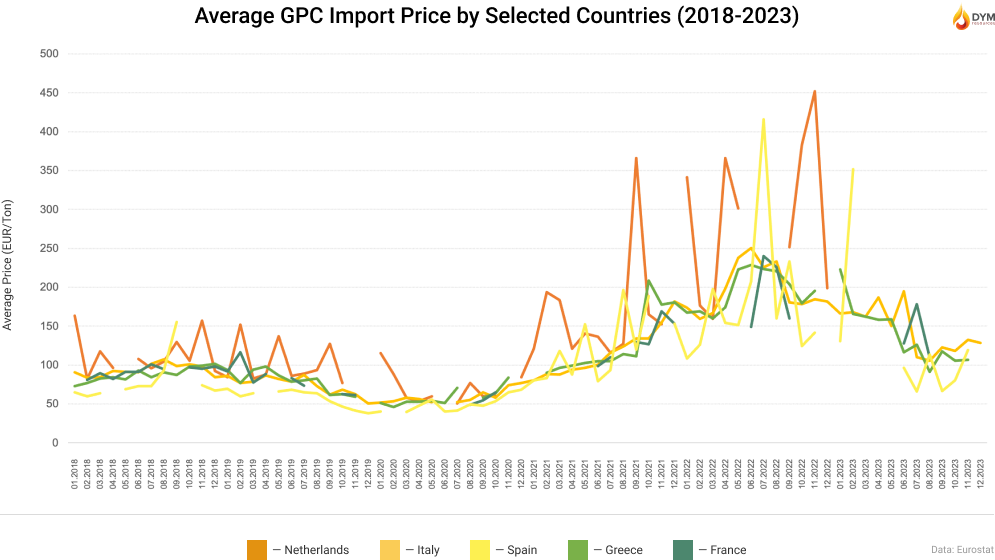
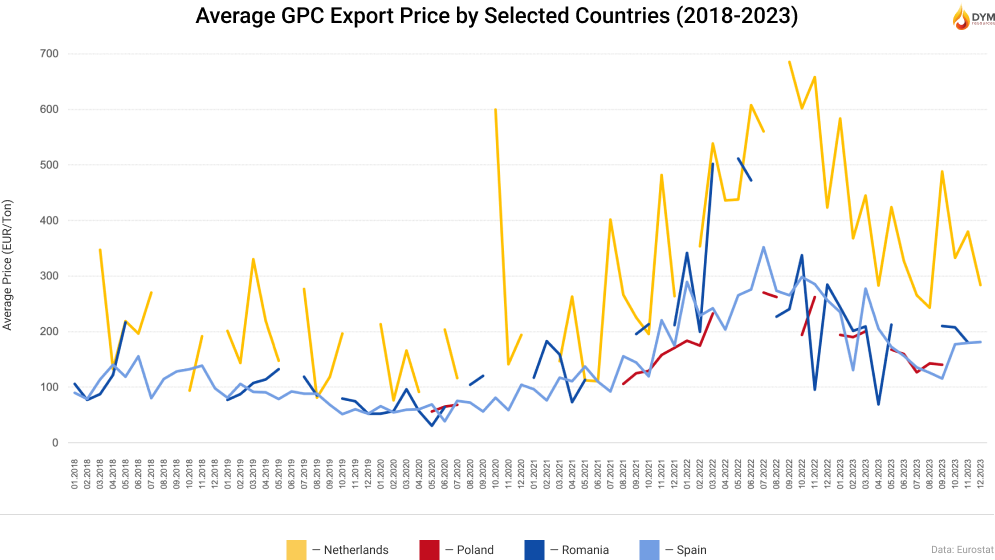
The decision to set a lower limit on trade volume is aimed at excluding minor import transactions of needle petroleum coke from countries like the United Kingdom, the United States, and Japan. Needle petcoke, which is significantly more expensive—costing 5 to 10 times more than standard grades—but traded in much smaller quantities, is predominantly used for the production of ultra-high-power (UHP) graphite electrodes. The main importers of needle coke within the EU are Spain, France, and Germany, which host substantial capacities for UHP electrode manufacturing.
By excluding smaller trade volumes, we aim to reduce statistical anomalies that can distort the overall analysis of price trends on our graphs. However, it’s important to note that while this method helps in refining our data presentation, completely eliminating these anomalies is not feasible. The representation, therefore, focuses on providing a balanced view of significant trade movements and price variations in the petroleum coke market across Europe.
Latest News and Media Outlook
This section focuses on recent developments in the European petroleum coke market, providing updates on industry trends, regulatory changes, and significant market activities within Europe.
Spain
Container traffic at Spanish ports increases by 9.0% in February
In February 2024, Spanish ports experienced an increase in container traffic, up 9.0%. However, this surge was marked by a significant decrease in bulk commodities like coal and petroleum coke, which fell by 56.4%. This decline underscores a shift in the commodity composition passing through these ports, reflecting changing market dynamics and demands in the energy sector.
Date: 05.04.2024
France
Court suspends an activity generating dangerous dust at the Port du Rhin
Court in Strasbourg suspended the storage of petroleum coke by the company SAPPE due to pollution concerns raised by nearby businesses. This legal action is the first of its kind in Strasbourg, emphasizing the environmental impact of petroleum coke storage in urban areas.
Date: 20.03.2024
Source: https://www.rue89strasbourg.com/justice-suspend-stockage-coke-petrole-port-du-rhin-297479
Do you want to receive all reviews of European Petcoke Quarterly by Legion Oil & Gas LLC on a regular basis?
Simply subscribe, and we will send you our analytic digest.
Closing Notes and Methodology
Data Sources and Analytical Methods:
- Statistical Sources: Our analysis primarily utilizes Eurostat datasets. Key datasets include:
- Transformation Output: Focusing on refineries and the petrochemical industry, specifically total refinery outputs.
- EU Trade Data: Comprehensive import and export data since 2002.
- Diagram Construction: All diagrams presented in this newsletter are derived from the above datasets.
- Pricing Analysis: Average price diagrams are constructed using data entries that exceed 4,000 metric tons to ensure relevance and statistical significance.
Feedback and Contact: Your insights and questions are invaluable to us. If you have any queries or would like to discuss any of the content featured in this newsletter, please do not hesitate to contact us.